Announcing MyInsights+
Every year the whole European Pharma industry gathers at the Veeva European Summit to discover the new and exciting trends which are transformed by Veeva into user friendly business tools and applications. As a trusted partner and Life Sciences expert, C-Clear Partners always actively participates and sponsors the event. The summit is an ideal time and place to learn about new capabilities, but also an excellent event to explain our vision on pharma to clients and prospects. During the event, we were bombarded with new interesting ideas and solutions. As always, we were impressed with a lot of things, but this summit was about to become different than any previous summit we had been to.
During all our Veeva implementations, one business case was always difficult to solve: how can we display all relevant information in one single view. This has always been one of the most important questions our customers asked and although we created very good solutions, we never found the silver bullet.
And there it was, amongst all the other Veeva announcements MyInsights was launched. A simple yet elegant way of reporting on data available in Veeva, on the mobile device. Was this the holy grail we had been searching for?
After a long and heated discussion with one of our clients at the bar, we decided to dive into this new capability! After the Veeva Summit we immediately started to investigate the topic, while our customer gathered valuable input from the field: what info would be most relevant for the end-user on their mobile Veeva solution?
As a Veeva and Salesforce partner we know the ins and outs of the Veeva functionalities by heart. But we quickly realized that the MyInsights functionality deviates a bit from the existing platform in a way that it’s built on HTML 5 and Javascript. Luckily these are two technologies that we master as well, so we formed a strong team of a business expert, Veeva expert and HTML5 / reporting expert.
We kicked off our mini-project and started to play with the out-of-the box summary report.
As expected it took us some time to get familiar with the way how those reports were built, but the more we were investigating it, the more excited we got.
In the meantime, our customer was getting more and more feedback and provided us with new and challenging requirements. The field force expressed their wishes and we quickly noticed that the standard charts and reports were not going to cut it, new objects should be included in the report, ….
We dived into the documentation and were able to start changing the types of charts, including new ways of navigating (to custom list views), including custom objects, …
As you can see in below screenshot we introduced some new chart types and included drill-down navigation from these charts to custom list views. Not only did the solutions satisfy our technology innovation bug, but the more we learned, the more we understood that the limit of the report was and is our imagination. This all resulted in an easy to use overview in the mobile Veeva solution where our sales rep is able to see the most important information about his customer:
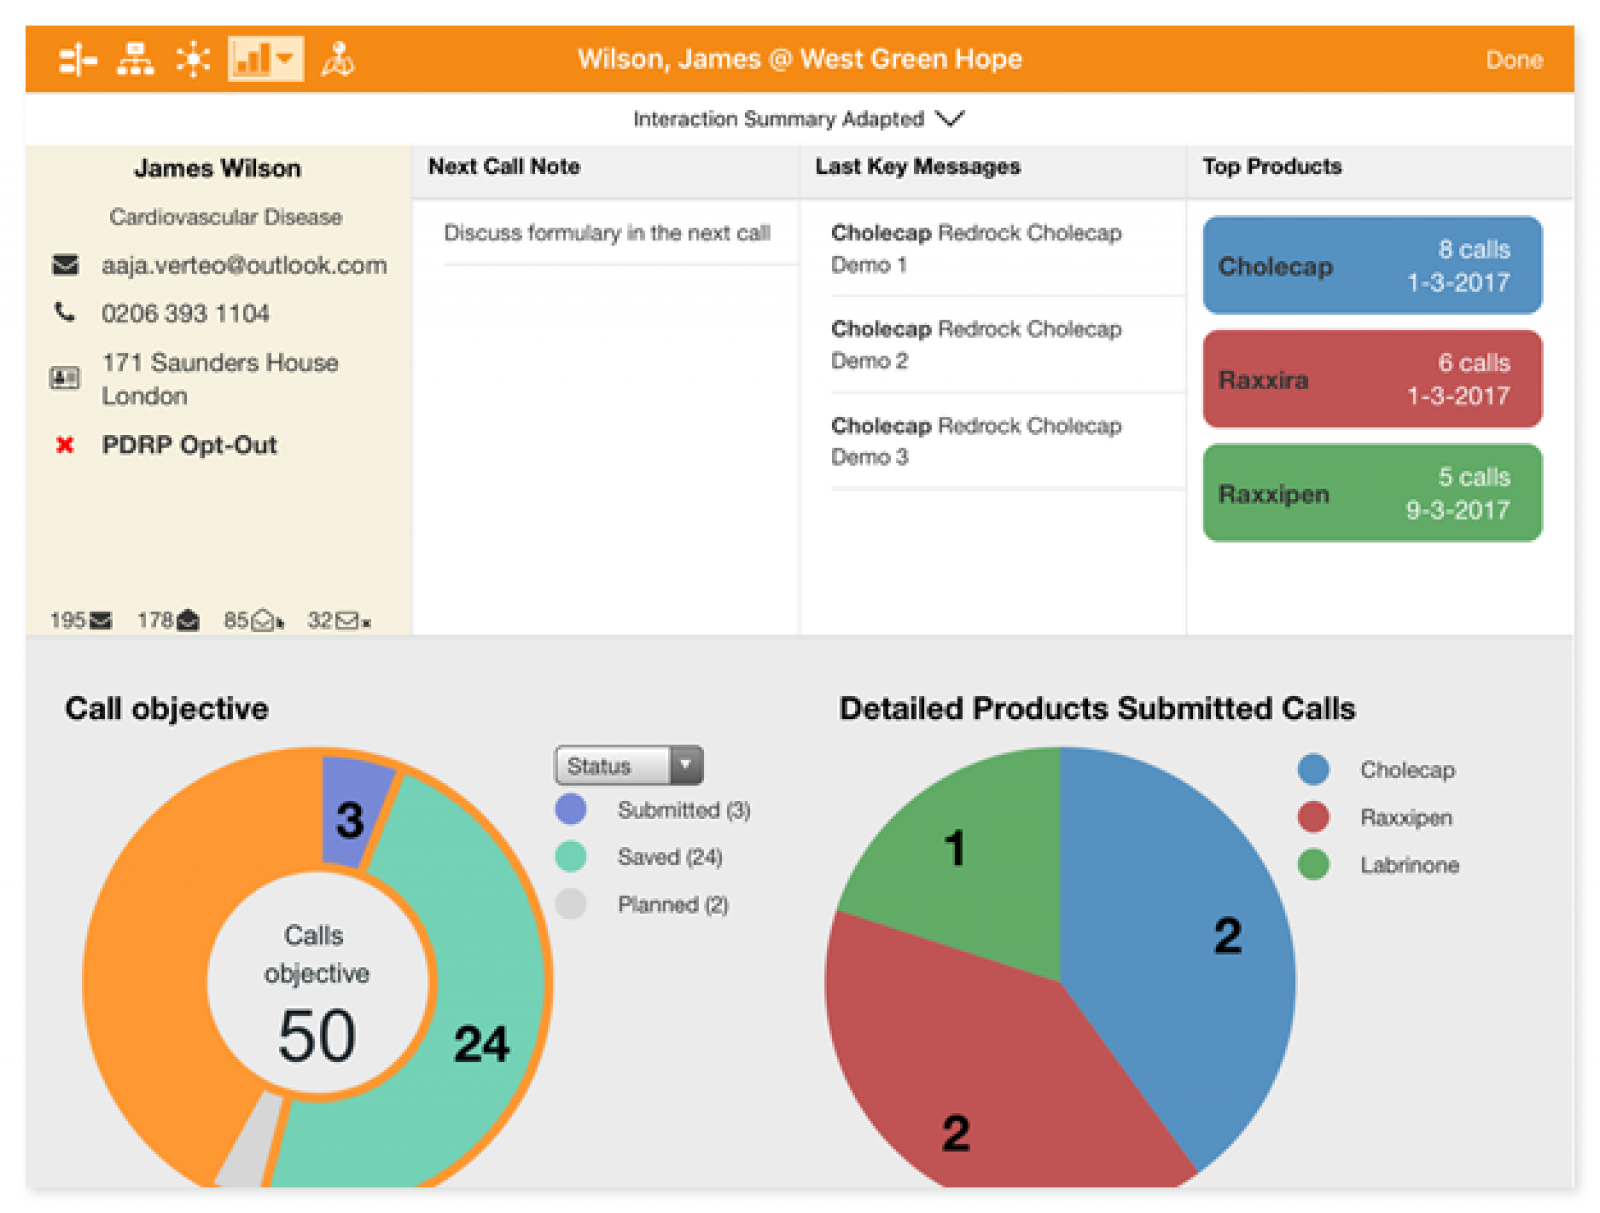
If the rep wants to see more detailed information, he/she just needs to drill-down via the chart itself to navigate to the details of the record(s).
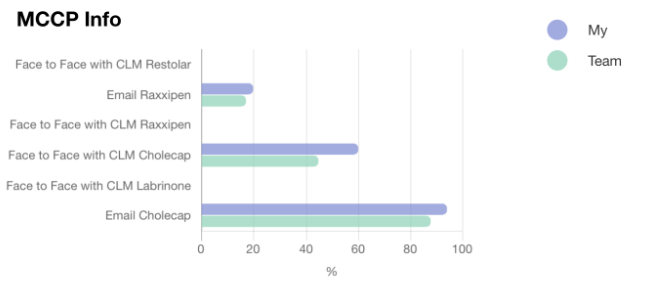
Although this is very nice, what we are most proud of, is a new visualization of the Multi-Channel Cycle plan. Within Veeva, it is not that easy to visualize the MCCP info per target account and you always have to start from the MCCP itself and then filter on the target account. This sometimes confuses the sales rep. MyInsights now enabled us to visualize it in a different way at a different place in the application. We were asked (see MCCP Info) to include a chart with the MCCP info linked to the target account. We combined the defined channels with product information for this target account. In blue you see the (product) attainment per channel in percentage, and in green the team attainment.
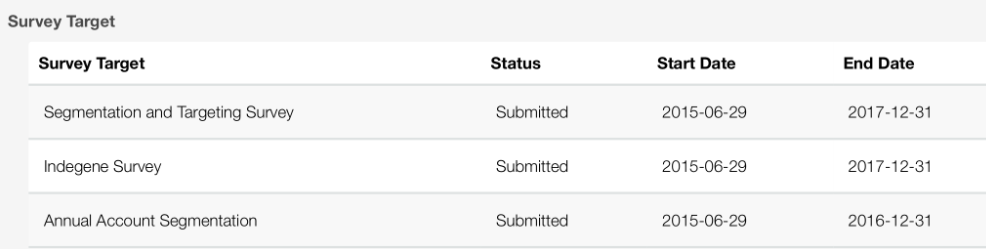
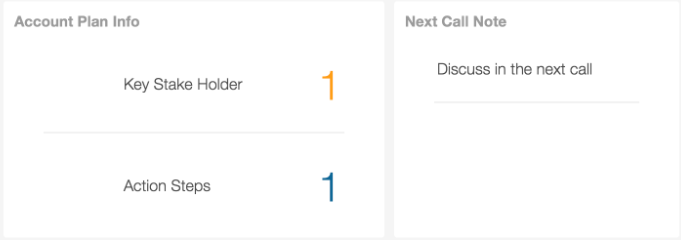
From a visualization point of view, charts are always nice to present data in a user-friendly way. However not all related account info can be presented in a chart and therefore we implemented some other ways to visualize account related info into the custom report. In the example below you can see the account plans in which the account is involved as a number field. This field allows to navigate to a list view to get the detailed information. As pre-call planning is crucial, we also included the Next Call Notes of the last submitted interaction. So, on the overview page the user immediately sees what needs to be discussed with the account on the next visit.
As always, the more we developed, the more we wanted and yes, we hit some limitations. As this is one of the first releases of MyInsights, not everything we wanted was already in the product. Having a strong partnership with Veeva, we were able to speak with the Veeva product Manager. We learned – safe harbor 😉 – that even more new and exciting functions and features are going to be added.
After the implementation of our first MyInsights report we received only positive feedback from the users, but one of the main hurdles was that to meet local needs across countries and profiles a different MyInsights report needed to be created. As it is quite complex and time consuming to change the zip file for every single profile and country, we decided to build a framework that offers this kind of flexibility. And this is how our MyInsights+ framework was born.
Within MyInsights+ we provide more flexibility in tailoring the MyInsights reports to local needs without changing the HTML5 report (zip file). An administrator can define directly in Veeva CRM online how the MyInsights report should be generated for a specific country and profile without touching the JavaScript and HTML5 code. Within the MyInsights+ framework you can define the visibility and order of the different reporting blocks, the fields that should be displayed in the account info section and which fields should be displayed in the different list views on the home page or behind the navigation from a chart. The framework is translation proof and locale formats are applied.
After completing the modifications within the MyInsights+ framework, the end user just has to sync again and the changes are immediately taken into account when the MyInsights report is displayed.
Our MyInsights+ framework offers a lot of flexibility, it is governance proof and it is release independent.
To bring it to the next level we also identified a roadmap of new functionalities we want to implement in our MyInsights+ framework:
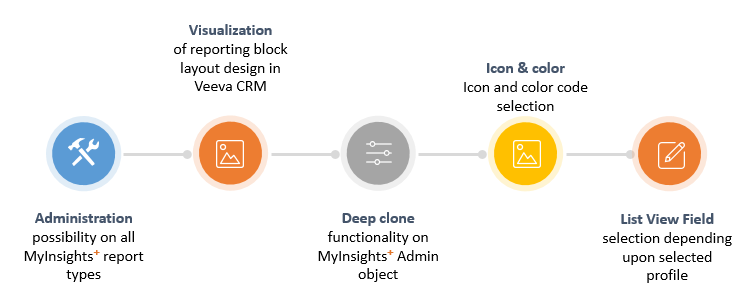
For us, there is no doubt about the added value that the MyInsights custom report functionality brings to the business. We are really convinced that with our MyInsights+ framework on top, it is even more powerful. In all conversations we have with our customers, the dream is always to have a 360 view of the customer on one single page, in the field, on their mobile device and an easy way to administrate this. And this new way of building custom reports via MyInsights and the MyInsights+ framework might just be that silver bullet we were looking for.
You can view the demo here.